
Mittlere Wasser- und Lufttemperaturen für den Zeitraum 2007 - 2023

| Datum | Wasser | Luft |
| 2.Woche Sept. | 15,6 | 13,6 |
| 3.Woche Sept. | 15,2 | 13,4 |
| 4.Woche Sept. | 13,6 | 11,7 |
| 1.Woche Okt. | 12,5 | 10,0 |
| 2.Woche Okt. | 10,9 | 9,1 |
| 3.Woche Okt. | 10,2 | 9,5 |
| 4.Woche Okt. | 8,8 | 7,4 |
| 1.Woche Nov. | 7,5 | 5,8 |
| 2.Woche Nov. | 5,7 | 3,7 |
| 3.Woche Nov. | 5,8 | 4,5 |
| 4.Woche Nov. | 4,2 | 2,4 |
| 1.Woche Dez. | 3,1 | 1,6 |
| 2.Woche Dez. | 3,0 | 1,9 |
| 3.Woche Dez. | 2,5 | -0,4 |
| 4.Woche Dez. | 3,1 | 3,0 |
| 1.Woche Jan. | 2,7 | 2,0 |
| 2.Woche Jan. | 2,7 | 2,0 |
| 3.Woche Jan. | 2,4 | 0,8 |
| 4.Woche Jan. | 2,0 | -1,0 |
| 1.Woche Feb. | 2,0 | 0,6 |
| 2.Woche Feb. | 1,9 | 0,7 |
| 3.Woche Feb. | 2,5 | 0,9 |
| 4.Woche Feb. | 2,2 | 1,6 |
| 1.Woche Mrz. | 2,9 | 2,5 |
| 2.Woche Mrz. | 3,5 | 3,2 |
| 3.Woche Mrz. | 4,7 | 5,5 |
| 4.Woche Mrz. | 6,1 | 5,4 |
| 1.Woche Apr. | 6,9 | 5,0 |
| 2.Woche Apr. | 6,2 | 4,7 |
| 3.Woche Apr. | 7,3 | 5,8 |
| 4.Woche Apr. | 7,9 | 8,1 |
Saison 2006/2007

Saison 2007/2008

Saison 2008/2009

Saison 2009/2010

Saison 2010/2011

Saison 2011/2012

Saison 2012/2013

Saison 2013/2014

Saison 2014/2015

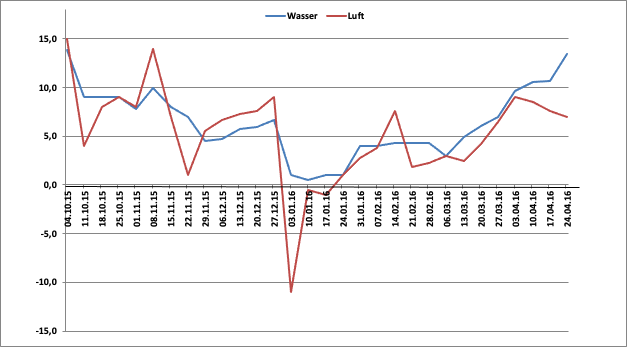
Saison 2015/2016
Saison 2016/2017

Saison 2017/2018

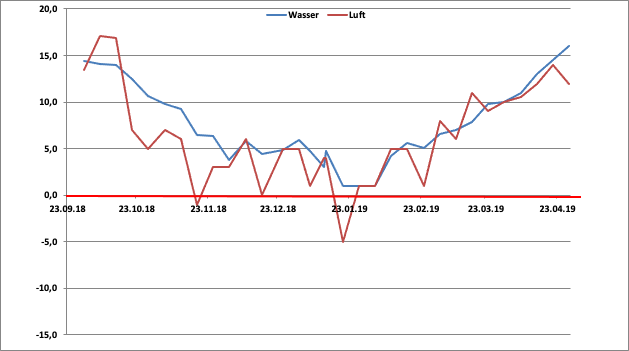
Saison 2018/2019
Saison 2019/2020

Saison 2020/2021 - wegen Coronapause nur mit Daten bis 24.10.2021

Saison 2021/2022

Saison 2022/2023
